因果推断学习笔记(五):画画因果图
很早很早就想要学习一下怎么画因果图,最近终于有时间折腾一下啦!这两周研究了一下怎么用非实验数据画因果图。关于因果图的理论知识这里就不再赘述,想要快速学习推荐读 A Survey of Learning Causality with Data: Problems and Methods [1] 的第四章,想要深度学习可以阅读 Judea Pearl 大佬的 Causality 教材 [2]。这篇文章主要是一些开源工具的使用体验。
经典算法介绍
使用非实验数据画因果图的方法主要可以分为以下几类 [2]:
- Constraint-based Algorithms. “This class of algorithms learn a set of causal graphs which satisfy
the conditional independence embedded in the data. These algorithms use statistical tests to verify
if a candidate graph fits all the independence based on the faithfulness assumption.”- 常见算法:PC 和变种、FCI、GFCI、RFCI……
- Score-based Algorithms. “Score-based algorithms replace conditional independence tests with the goodness of fit tests. Score-based algorithms learn causal graphs by maximizing the scoring criterion which returns the score of the causal graph given data.”
- 常见算法:Greedy Equivalence Search (GES)、FGES……
- Algorithms based on Functional Causal Models (FCMs). “In FCMs, a variable can be written as a function of its directed causes and some noise term.”
- 常见算法:Linear Non-Gaussian Acyclic Model (LiNGAM)、ICA-LiNGAM……
公开数据集
要跑体验不同的工具和不同的算法,首先需要一些带有因果图 ground-truth 的数据集。以下是一些公开数据集。接下来的体验过程使用第一个数据 LUCAS。
- LUng CAncer Simple set (LUCAS):一个根据已知的因果图生成的数据
![]()
- Pittsburgh Bridges Data Set:包含桥的七个属性(specification properties)和五个设计决策 (design description),部分边的方向已知(Erected->Span, Material->Span, Material->Lanes, Purpose->Type)
- Abalone Data Set:包含鲍鱼的性别、长度、直径、高度、总重量、剥壳重量、内脏重量、壳重、环的数量(+1.5即为年龄),部分边的方向已知(Sex->Length, Sex->Diameter, Sex->Height)
- Database with cause-effect pairs (Tbingen Cause-Effect Pairs):包含大量两个变量的数据以及边方向的 ground truth。
- 开源工具 CausalDiscoveryToolbox 中内置了数据集 Tuebingen, Sachs 和 DREAM4
开源工具情况
一些开源工具集成了大量画因果图的方法。这些工具不仅包含了画因果图的部分,还包含了利用因果图推断因果效应的算法。下文只包含了用它们画因果图的体验结果。
- Tetrad (Java,有图形界面)
- GitHub 项目 cmu-phil/tetrad 更新活跃
- 有 Python 的 Wrapper(在 Win7 上似乎只有 Python3.6 才能恰好满足所有依赖,暂时放弃)
- CausalDiscoveryToolbox (Python)
- GitHub 项目 Diviyan-Kalainathan/CausalDiscoveryToolbox 更新活跃
- pcalg: Methods for Graphical Models and Causal Inference (R)
- 从 GitHub 镜像 CRAN/pcalg 来看,这个包 2006 年就存在了,目前依然保持更新
开源工具尝试之 Tetrad
Tetrad 中部分画因果图的算法汇总如下表,只保留了满足以下条件的算法,感觉比较通用:
- 输入:支持同时含有连续和离散变量的数据、允许用户提供关于因果图的领域知识(domain knowledge)
- 输出:有向图
Tetrad 完整的算法介绍见文档:http://cmu-phil.github.io/tetrad/manual/#search_box
| 方法名 | 算法类型 | 输入 | 输出 | 允许 latent common causes 的存在 |
|---|---|---|---|---|
| PC Variants | constraint-based | The algorithm effectively takes conditional independence facts as input. Thus it will work for any type of data for which a conditional independence facts are known. | An equivalence class of directed acyclic graphs (DAGs). | |
| FCI | constraint-based | The data are continuous, discrete, or mixed. | A partial ancestral graph (PAG). | Y |
| RFCI | constraint-based | Data for which a conditional independence test is available. | A partial ancestral graph (PAG). | Y |
| FGES | score-based | The data are continuous, discrete, or mixed. | An equivalence class of directed acyclic graphs (DAGs). | |
| GFCI | FGES (score-based) +FCI (constraint-based) | The data are continuous, discrete, or mixed. | A partial ancestral graph (PAG). | Y |
在 LUng CAncer Simple set (LUCAS) 这份数据上,我尝试了两类算法:
- 第一类方法允许 latent common causes 存在
- 第二类方法是假设不存在 latent common causes,个人感觉这个假设也相当于某种领域知识
对于每个算法,我做了两次尝试:
- 第一次尝试不提供任何关于因果图结构的领域知识(domain knowledge)
- 第二次尝试时提供关于因果图结构的领域知识:所有变量都不应影响 Genetics,并且 Born_an_Even_Day 不应影响任何变量(其实仔细想想还能提供更多的,这里就先这样吧)
Tetrad 工程如下,非常直观。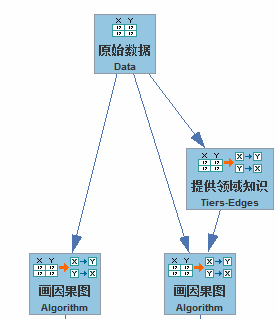
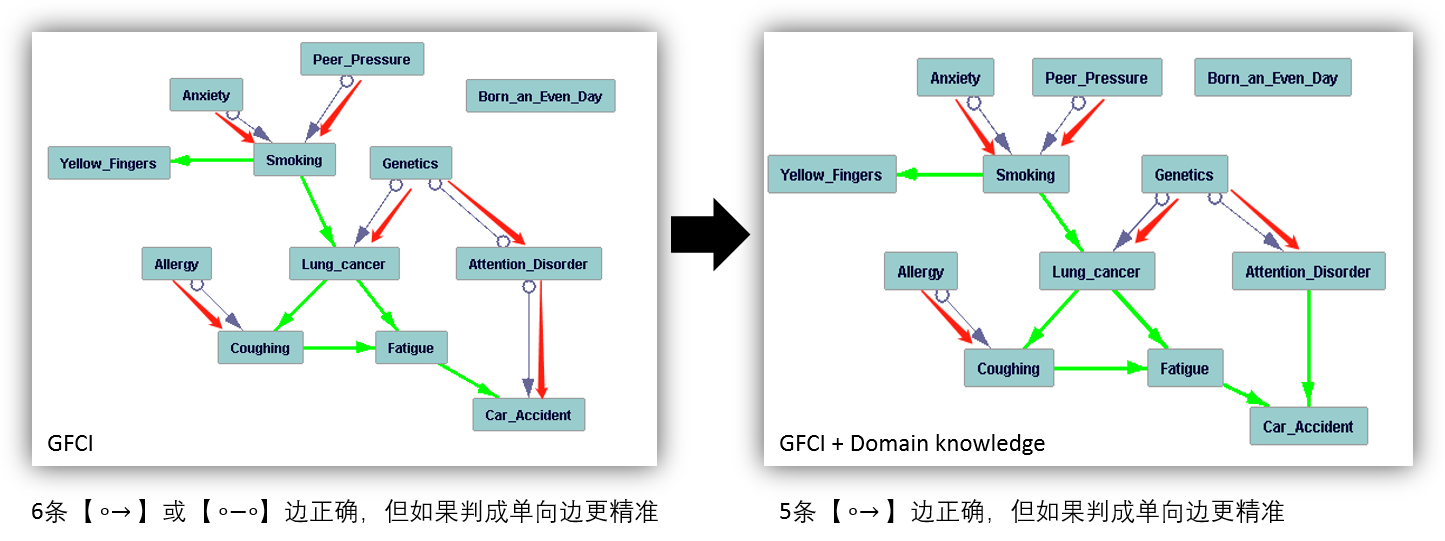
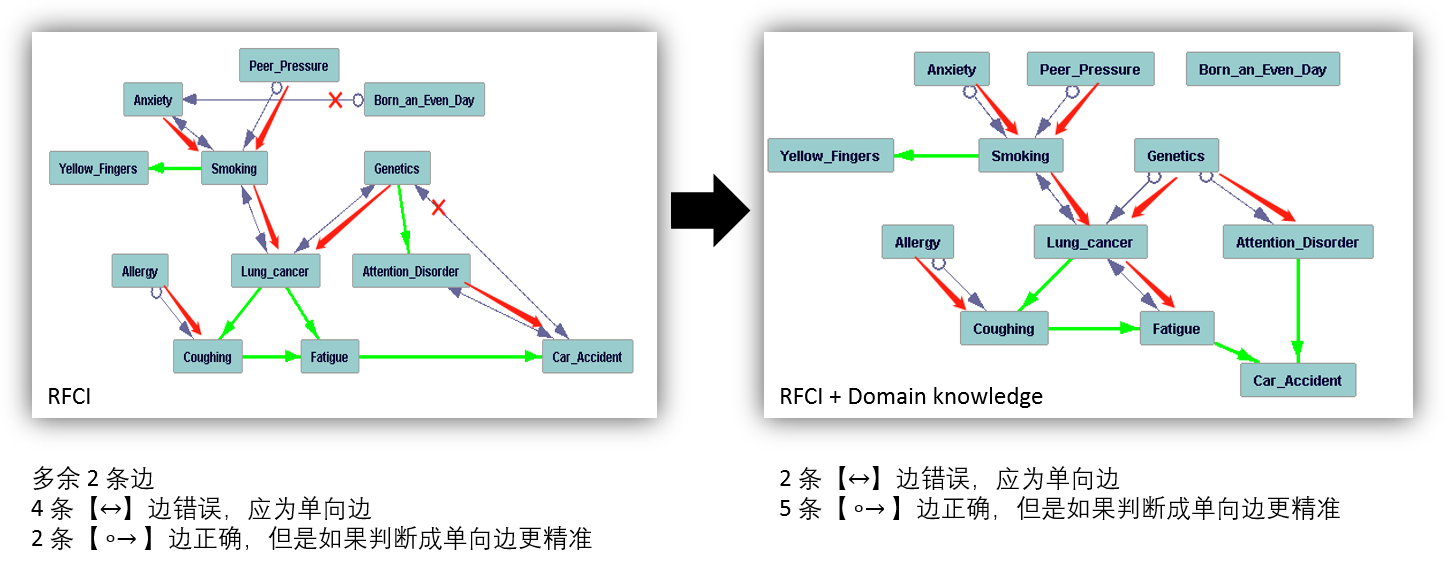
允许 latent common causes 存在的方法的结果如下。每一行的左边是不使用领域知识时的算法结果,右边是加入了关于图结构的领域知识后的算法结果。加了领域知识可以大大提升因果图的准确性,十分符合常理。GFCI 和 RFCI 在 LUCAS 这个数据集上的效果要比 FCI 好一些。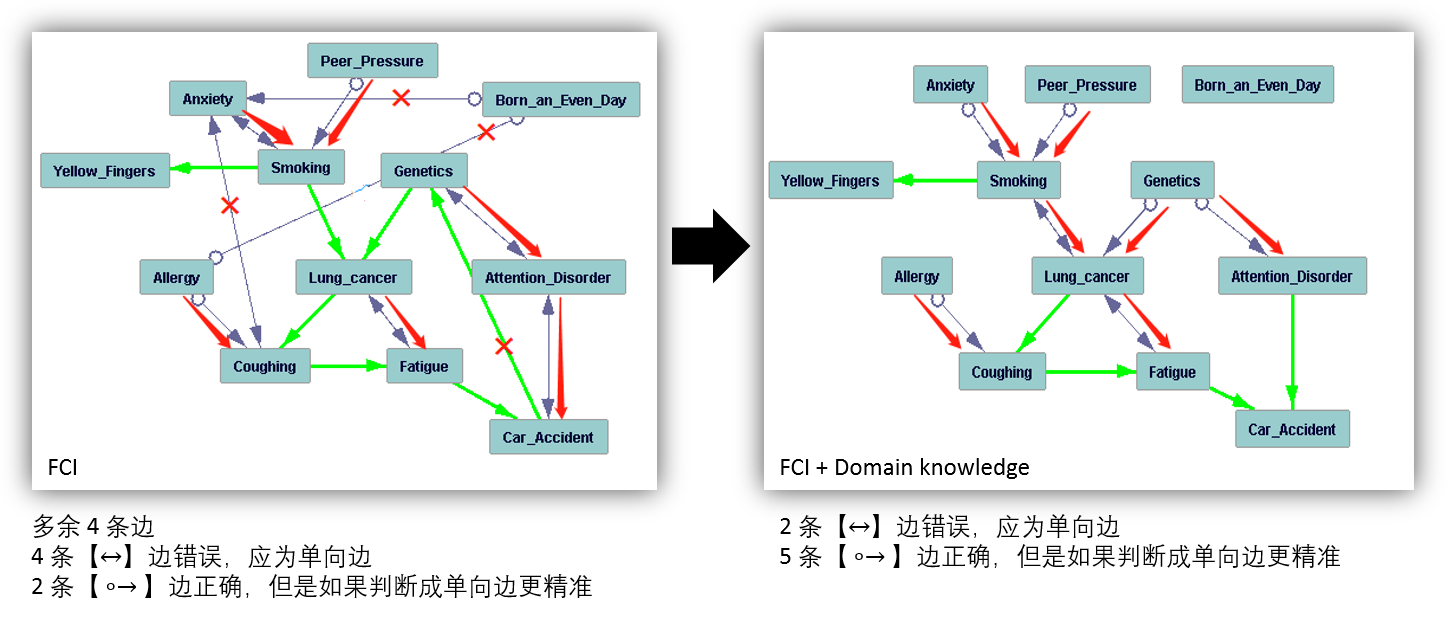
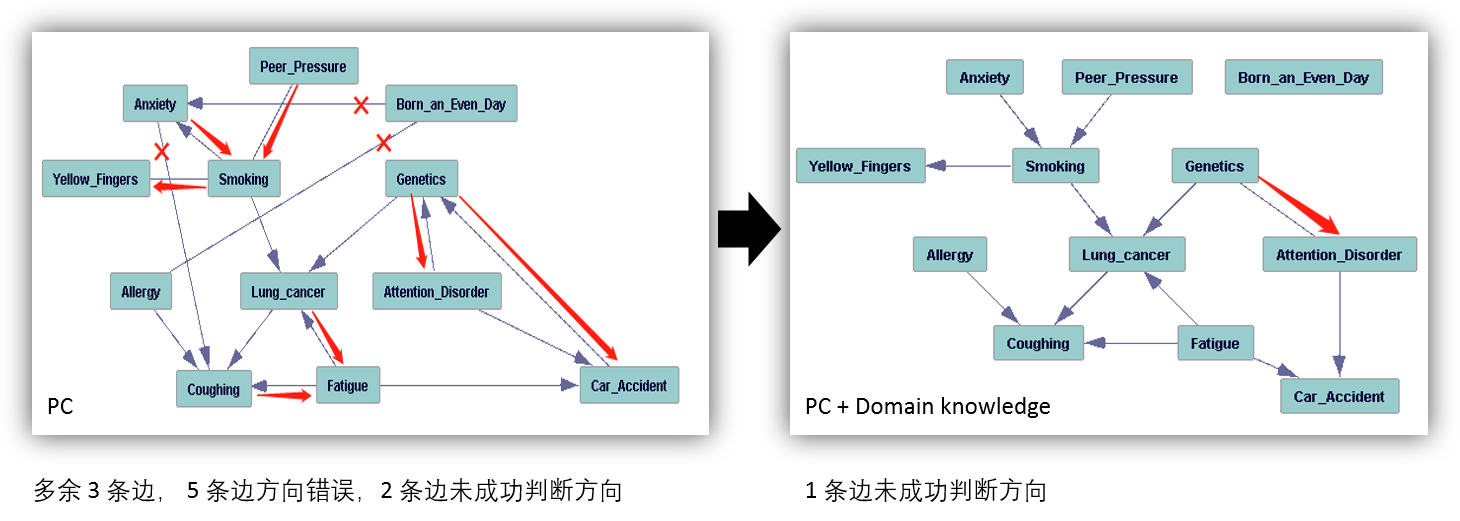
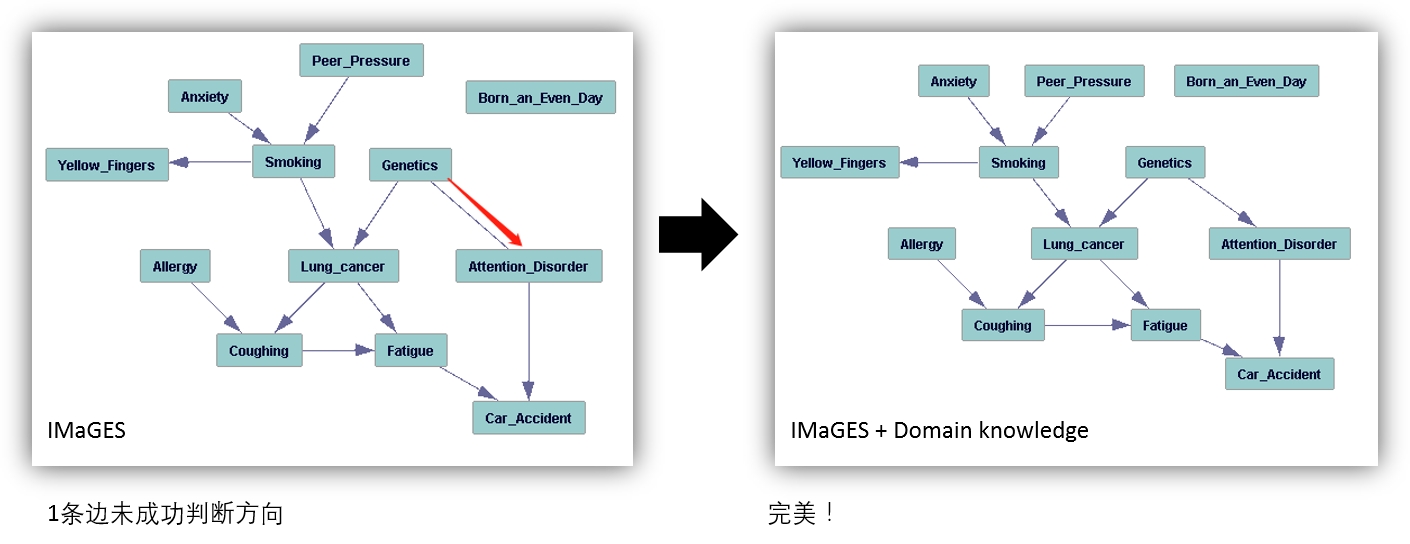
假设不存在 latent common causes 的方法的结果如下。在这个数据中,“不存在 latent common causes” 这个假设是正确的,基于这个假设得出的因果图也好了很多。
Tetrad 尝试小结
优点
- 有图形界面,易上手、画完图还能自己拖动节点调整布局
- 可以以各种方式提供关于因果图的领域知识,例如:有些边不能存在、有些边必须存在、有些边的方向必须是哪儿到哪儿……
缺点
- 图形界面,并且用 Java 编写,集成到 Python 工程可能比较困难
开源工具尝试之 CausalDiscoveryToolbox
CausalDiscoveryToolbox 的简称为 cdt。cdt 的上手比较方便,一段很简单的代码就可以跑 PC 算法。
1 | import cdt |
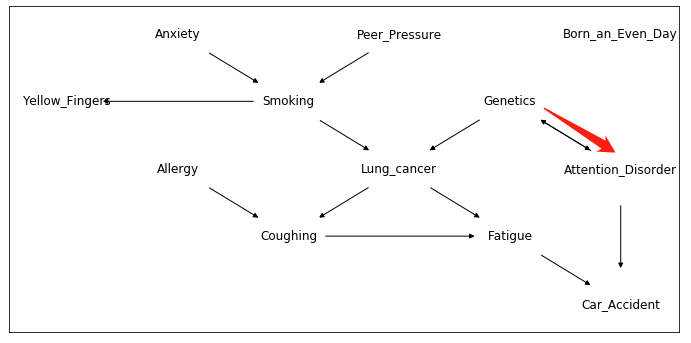
结果如下图。这里虽然没有提供任何关于因果图结构的领域知识,结果已经和 Tetrad 的 PC+Knowledge 的结果一样了,可能是两个软件包中 PC 的具体实现或默认参数有所不同。
CausalDiscoveryToolbox 尝试小结
优点
- 使用 Python,方便和其它 Python 工程集成在一起
- 接口简单,容易调用
缺点
- 相比于 Tetrad, cdt 能接受的领域知识很有限: 只接受关于 skeleton 的领域知识,即用户只能提供关于”某条边必须存在/不存在”的知识,无法对边的方向提供任何建议
- 集成的方法较少(希望后续会加上,开发者似乎更新得很勤快)
- 有一些文档自带的例子会跑挂,原因未知
开源工具尝试之 pcalg
pcalg 是一个久经沙场的 R 包,存在已经十多年了,包含了大量画因果图的方法。以下是一段跑 PC 算法的代码。
1 | library(data.table) |
试跑了几种算法,结果如下。FCI、RFCI 和 GES 都很不准确,可能是由于只人肉提供了非常有限的先验知识,也可能是由于没有仔细研究每个算法可以调整的各种参数和配置。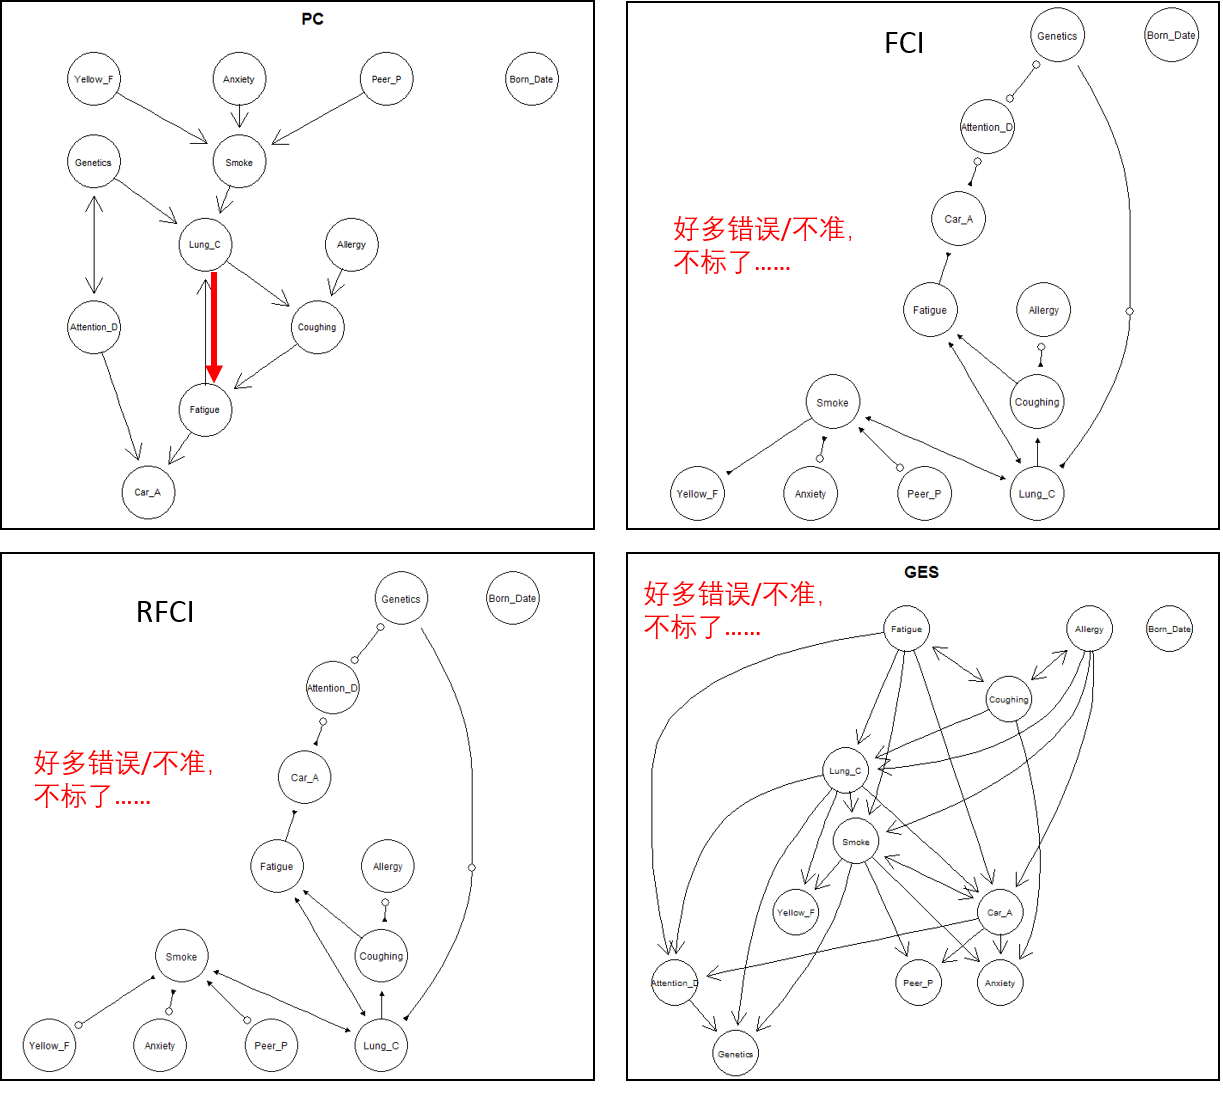
pcalg 尝试小结
优点
- 久经考验
- 算法齐全
缺点
- 相比于 Tetrad,在画因果图时只接受关于 skeleton 的领域知识,即用户只能提供关于”某条边必须存在/不存在”的知识,并不能对边的方向提供任何建议
- 在画好因果图后,如果算法成功返回了 CPDAG 或 PAG,用户可以继续提供关于边的方向的领域知识,对图进行修正;但是算法返回的因果图不一定是 CPDAG 或 PAG,这时就无法提供领域知识了,满脑子领域知识没地方用是很愁人的……
- 画的图真的很丑,尤其是节点多或图很稠密的时候……
开源工具尝试小结
对于工具的挑选,个人觉得 Tetrad 最好用,主要考虑如下:
- 有图形界面,虽然界面比较复古,但是功能很完整,即使不看文档好像也可以直接用起来
- 能提供各种各样的领域知识
- 画的图挺好看的,还可以再图形界面中拖布局
参考资料
[1] Pearl J. Causality: models, reasoning and inference[M]. Cambridge: MIT press, 2000.
[2] Guo R, Cheng L, Li J, et al. A Survey of Learning Causality with Data: Problems and Methods[J]. arXiv preprint arXiv:1809.09337, 2018.
[3] rguo12/awesome-causality-algorithms:https://github.com/rguo12/awesome-causality-algorithms
[4] rguo12/awesome-causality-data:https://github.com/rguo12/awesome-causality-data
[5] Tetrad
[6] CausalDiscoveryToolbox (cdt)
[7] pcalg: Methods for Graphical Models and Causal Inference